


Full Russian Version 
Flow cytometry of pico- and nanoplankton from the W Black sea open waters (R/V "Prof. Vodyanitsky, cruise #72, may 2013)
Vertical distribution of microbial abundance and activity was studied along the 9-station transect from the deep waters of the Western Gyre (WG) northward to the Northwest Shelf (Fig. 1). Highest bacterioplankton abundances were observed at the shallow stations in the thermocline layer (Fig. 2). In the WG, bacteria were more abundant in the photic layer under the thermocline. Their peaks moved deeper to 80 m in correspondence with the deepening of the suboxic layer northward from the centre to the periphery of the WG (Fig. 2). Just under the suboxic layer, significant increase in bacterial size and physiological activity was registered (Fig.2). In the areas of distinct vertical gradients of water temperature and salinity on the WG periphery, bacterioplankton abundance and activity were low (Figs. 2 and 3). In the deep photic layer at about 50 m, peaks of nitrites and cyanobacterial abundance coincided (Figs. 4 and 5). According to flow cytometric data, the community was dominated by Synechococcus able to utilize nitrites as N source (Fig. 6).
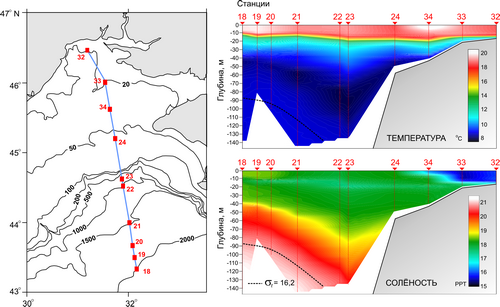
Fig. 1 Stations of the transect from Dnepr estuary to the centre of the Western Gyre. Temperature and salinity along the transect (data by V. Zhuk and V. Vasilenko). Lower border of the suboxic layer (σt = 16.2) is shown as dashed line.
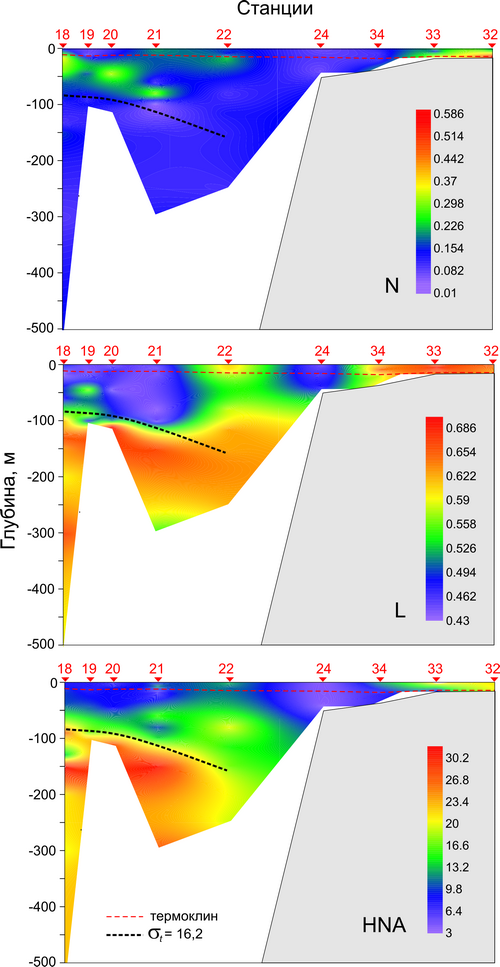
Fig. 2 Vertical distribution of bacterioplankton abundance (N, 106 cells ml-1), cell size (equiv. sphere diam. L, um), HNA-bacteria (%) along the transect from the centre of the Western Gyre to Dnepr estuary. Thermocline and lower border of the suboxic layer (σt = 16.2) are shown as red and black dashed lines, respectively.
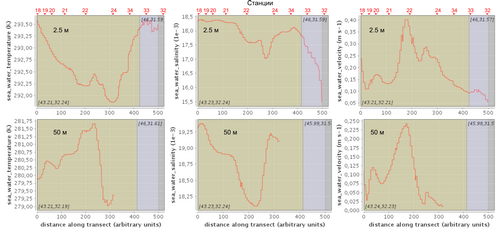
Fig. 3 Satellite data (MyOcean, http://www.myocean.eu/) on temperature (left), salinity (middle) and flow velocity (right) at the depths of 2.5 m (top plots) and 50 m along the transect from the centre of the Western Gyre to Dnepr estuary.
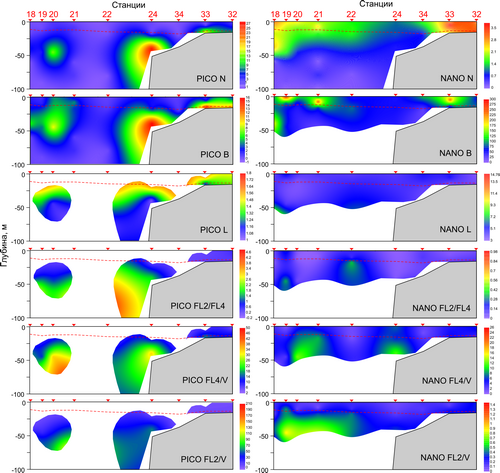
Fig. 4 Abundance (N, 103 cells ml-1), biomass (B), cell size (L, um), intracellular PE/Chl a ratio (FL2/FL4), PE per cell volume (FL2/V, rel. u.) and Chl a per cell (FL4/V, rel. u.) in pico- (PICO) and nanophytoplankton (NANO).
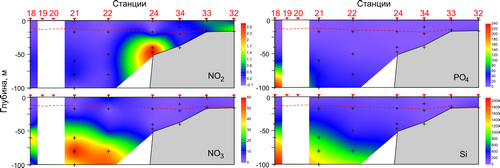
Fig. 5 Nutrients profiles (ug L-1). Data provided by N. Rodionova.
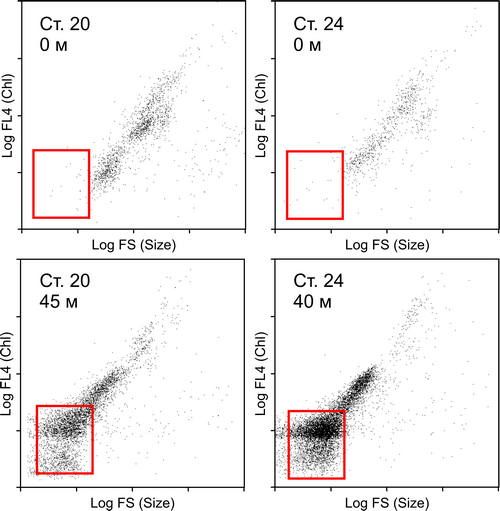
Fig. 6 Flow cytometry of small phytoplankton at St. 20 (left) and St. 24 (right) in the surface layer (top) and at 50 m (bottom). Synechococcus is gated.